Difference between revisions of "VCloud.ai Traffic Intensity Determination VCA"
(Created page with "<strong>Traffic - Module of Traffic Intensity Determination</strong><br> == Main functionality <br> == • Determinate the level of carriageway and sidewalks load at different times of day<br> • Monitor the traffic in shopping centers and other premises with considerable congestion of people<br> • Determination of cars and trucks, public transport, motorcycles, bicycles, pedestrians, etc. traffic intensity.<br> == Product Description <br> == The <strong>Traffic</s...") |
|||
| Line 45: | Line 45: | ||
<tr> | <tr> | ||
<td>Operating system</td> | <td>Operating system</td> | ||
<td>Ubuntu | <td>Ubuntu 20.04</td> | ||
</tr> | </tr> | ||
</table> | </table> | ||
Latest revision as of 19:31, 13 November 2023
Traffic - Module of Traffic Intensity Determination
Main functionality
• Determinate the level of carriageway and sidewalks load at different times of day
• Monitor the traffic in shopping centers and other premises with considerable congestion of people
• Determination of cars and trucks, public transport, motorcycles, bicycles, pedestrians, etc. traffic intensity.
Product Description
The Traffic module is intended for the calculation of intensity and determination of traffic structure according to the video image. Video arrives directly from surveys and special cameras online.
“Traffic” module can be used for:
• Prevention of traffic jams or excessive congestion of people formation on roads and infrastructure facilities;
• Forecasting of streets, roads, or areas load depending on the time of day, a season or day of the week;
• Determinations of optimal routes for the couriers, transport, or personnel transportation movement to minimize the risk of a hit in traffic jams;
• Determinations of supermarkets, shopping centers passability level.
Basic data which are used by module:
• Determination of intensity, quantity, and structure of vehicles on certain location/street/area per time unit
• Analysis of vehicles and people traffic on the basis of the images received from surveillance cameras
Sysyem Requirements
It is necessary to have the minimum system requirements for one video stream for Traffic module installation on GPU as in the table below.
| Parameter | Recommended value |
|---|---|
| CPU | Intel Core i5-5575 or higher |
| RAM | 1 GB RAM |
| GPU | NVIDIA 1030 |
| Places for archive | 1 GB in a month |
| Operating system | Ubuntu 20.04 |
Analysis
In order to open the Traffic analytics, select Traffic in the left menu and pass to the Analytics section.
In the Analytics section, you can customize analytics. The page displays a list of analytics with the status and the ability to add, edit, view, or delete analytics.
There is a search field at the top of the page. Here you can filter analytics by the following parameters:
| Field name | Description |
|---|---|
| Name | Analytics name or part of a name can be entered in this field |
| Status | Select the Analytics status from the drop-down list - All, Active, or Stopped |
To start the search click on the Find button. To clear the fields click on the Reset button.
The list of analytics is shown in the table below.
Analytics Adding
In order to add new Traffic analytics, press Add Analytics in the upper right corner of the page.
The Traffic analytics setup process consists of 3 Steps.
Step 1 - General
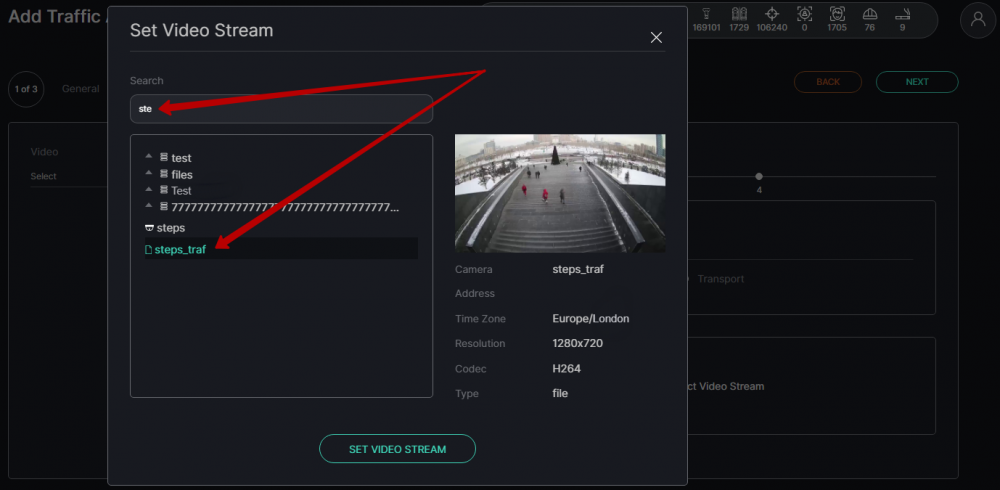
First of all, it is necessary to select a video stream. Click on the Video field and select the camera name from a list.
You can also enter the part of the camera name in the Search field to find the necessary video stream faster.
On the right side of the window, you can see the video stream preview and information about Camera name and Address, Time Zone, Resolution, Codec, and Type.
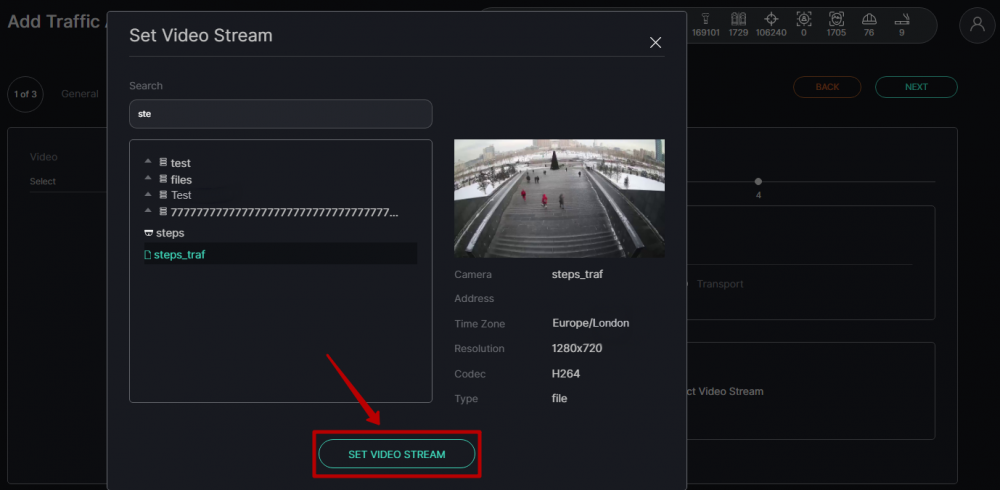
When the video stream is selected press the Set Video Stream button.
By pressing the Update Video Frame button you can see a frame in real-time in the field of frame addition.
It is possible if a video stream was selected.
To add analytics it is necessary to set up the following parameters:
| Parameter | Description |
|---|---|
| Tracker Sensitivity | Move the slider to the left (to decrease) or to the right (to increase) the tracker sensitivity. Possible range from 1 to 8, the value is 4 by default |
| Update Frequency | Enter the interval between analytics value updates in seconds. Possible range from 1 to 100 sec |
| Object Type | Select object type (person or transport) for traffic tracking |
| Recognition Options | Parameters on which the chosen object recognition is performed |
Recognition Options
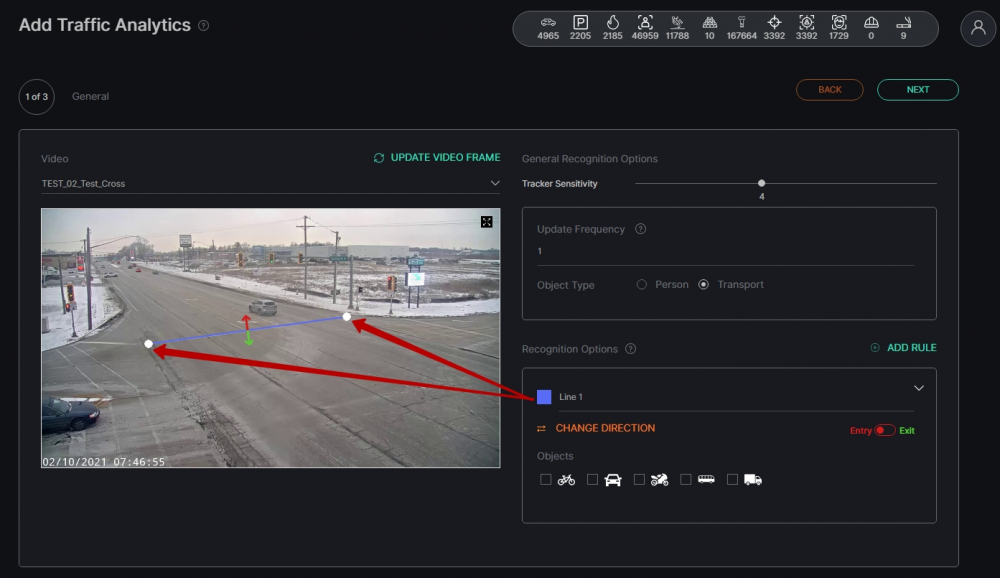
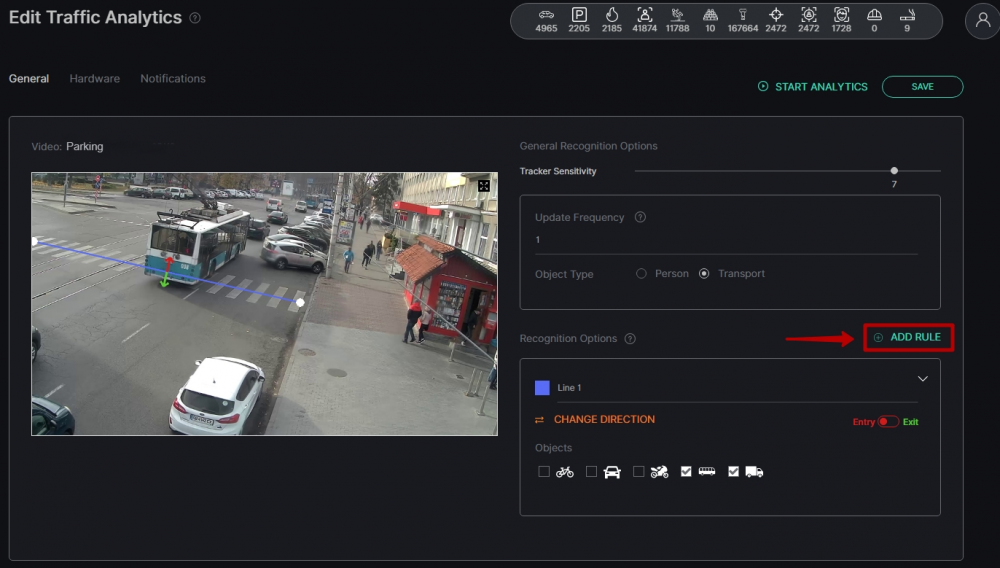
Add lines to the area of interest. This function allows tracing the object traffic.
Each line appears in the middle of the area by default.
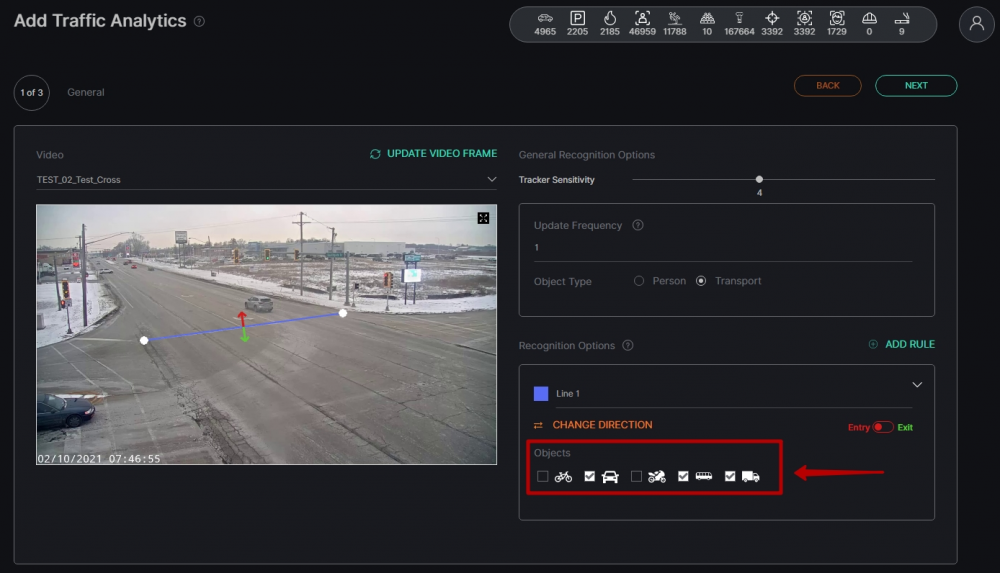
Move the line markers to the desired place (as in the example) to set the line perpendicular to the intended objects' movement.
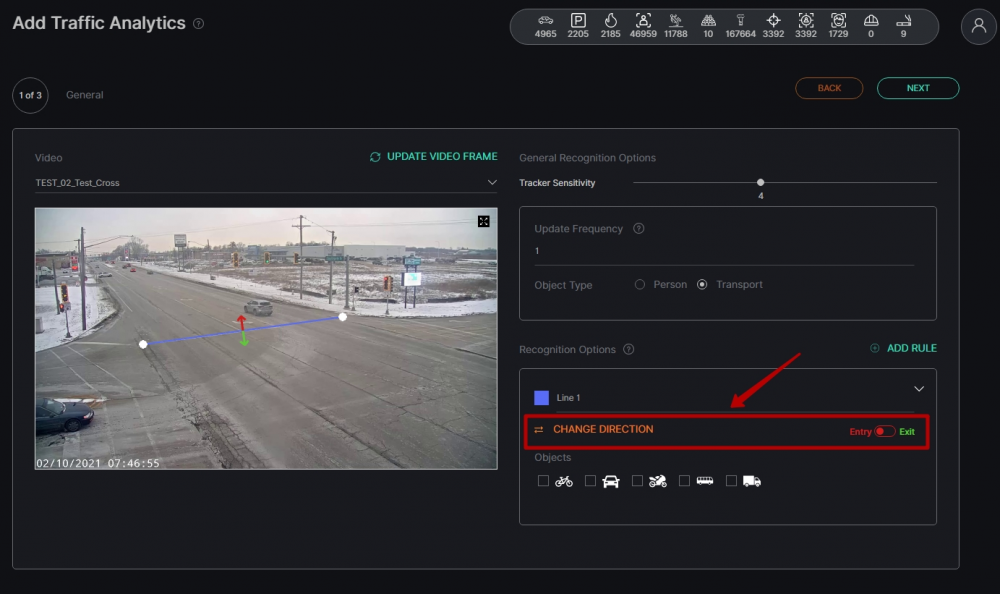
Then set the traffic accounting direction. For this purpose click on the Change Direction button. The arrow will change its direction after each click on the button.
If you use two-way directions - determine the direction of Entry and Exit by moving the slider to the left or right side.
Note: If you use one-way direction, the Entry/Exit slider is unavailable.
Finally, if you have chosen the Transport object type earlier, check the boxes next to the desired objects for traffic counting in the Objects section.
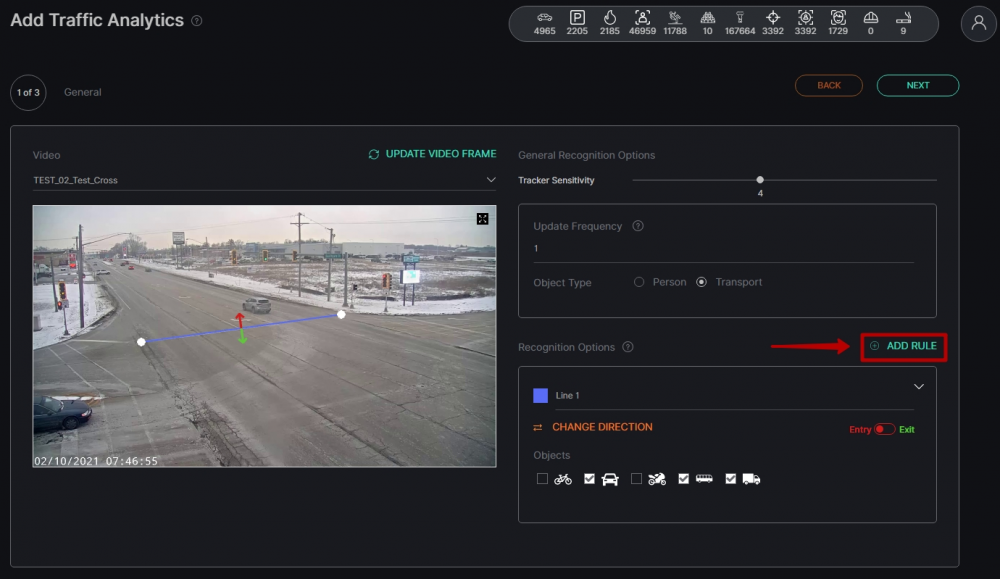
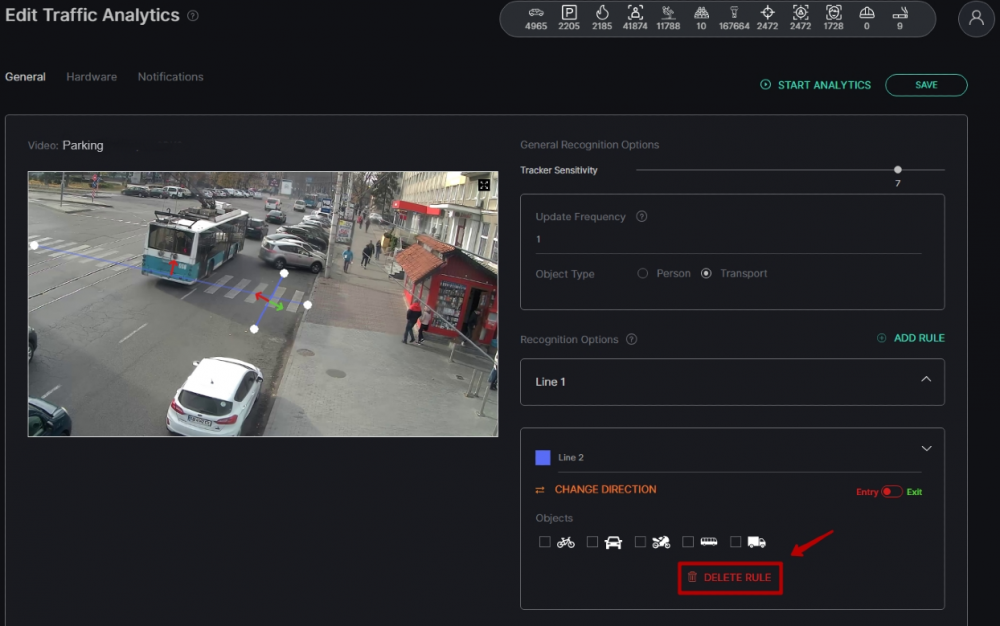
Note: If you have chosen the Person object type, the section Objects is unavailable. If you need to add more lines with different rules, click on the Add Rule button.
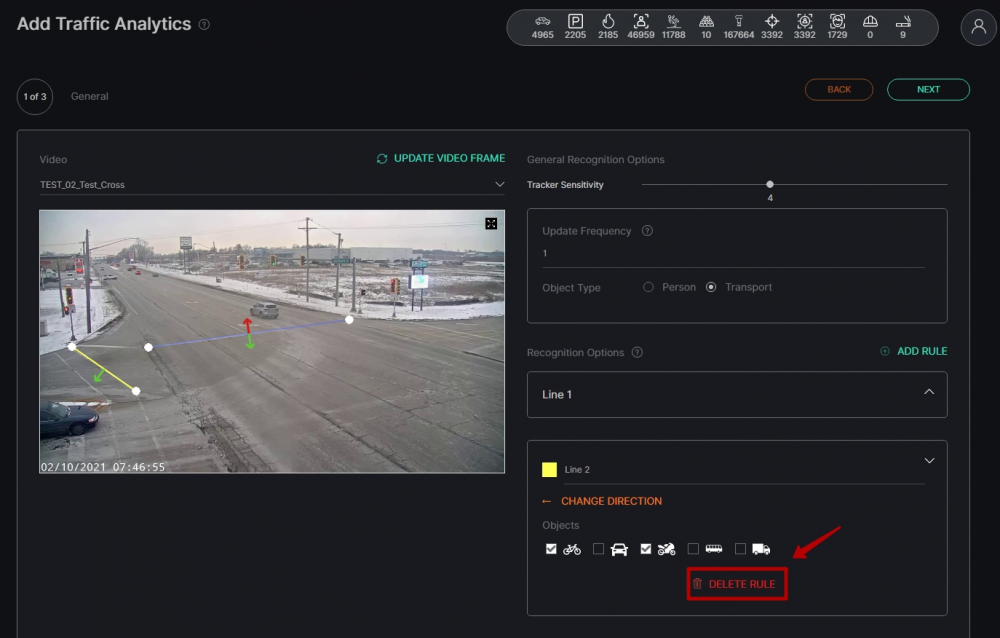
If you want to delete some lines, click on the Delete Rule button.
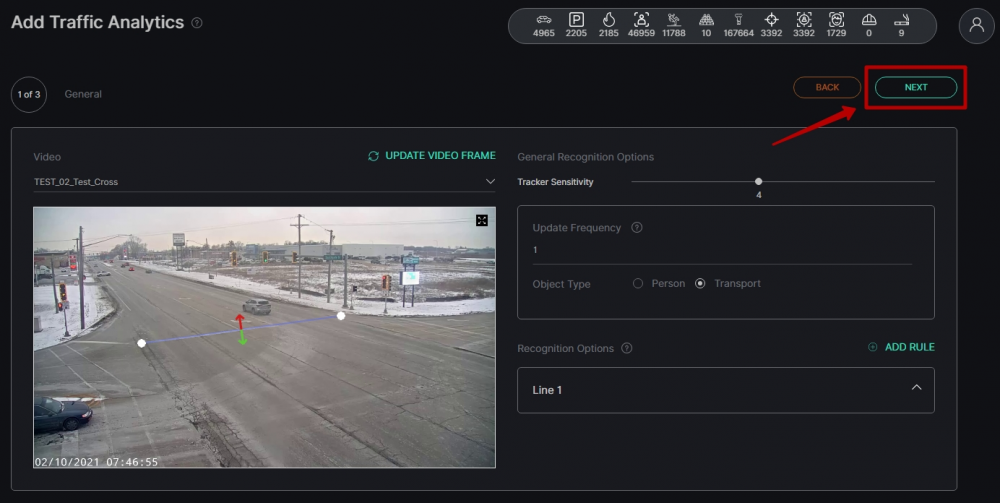
To pass to the next step, click on the Next button in the upper right corner of the page
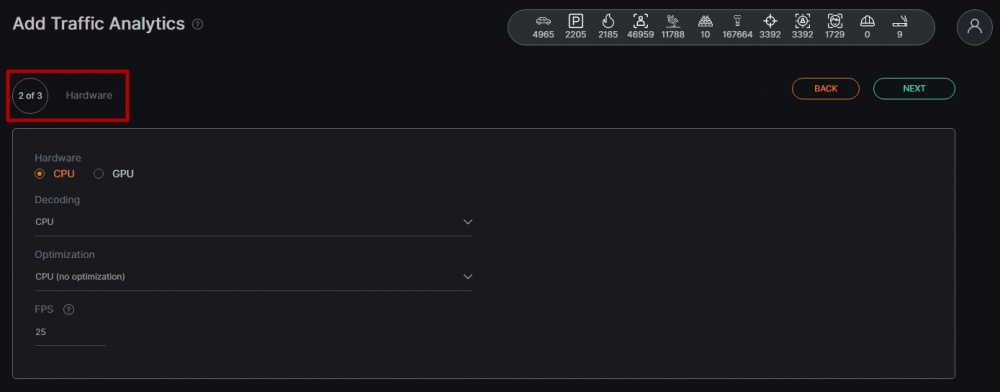
Step 2 — Hardware
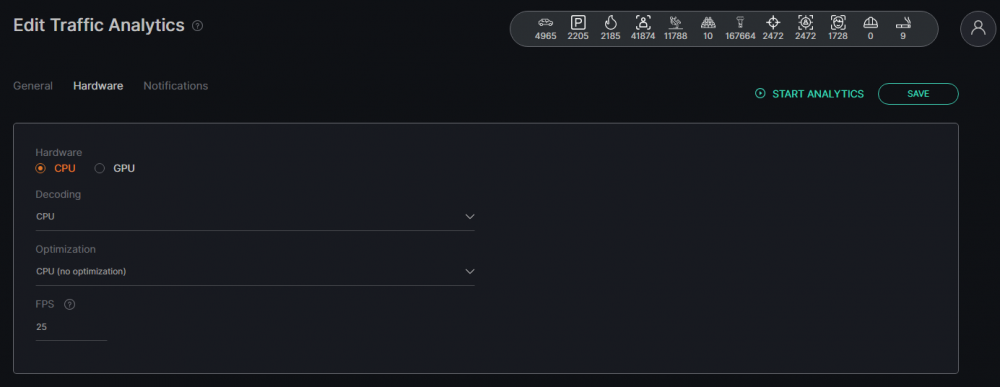
Now it is time to customize Hardware options. System users can change the following parameters:
| Parameter | Description |
|---|---|
| Hardware | Select one of the technologies - CPU or GPU acceleration |
| Decoding | Select the hardware decoder from the drop-down list - CPU, Intel, Nvidia |
| Optimization | Select the optimization parameter from the drop-down list (for CPU - CPU (no optimization), Open VINO; for GPU - CUDA (no optimization), cuDNN Half (FP16), Tensor RT) |
| FPS | Enter the desired number of frames per second in the field for detection. The recommended value is 25 |
When all necessary parameters are selected, go forward to the last step by clicking on the Next button in the upper right corner of the page.
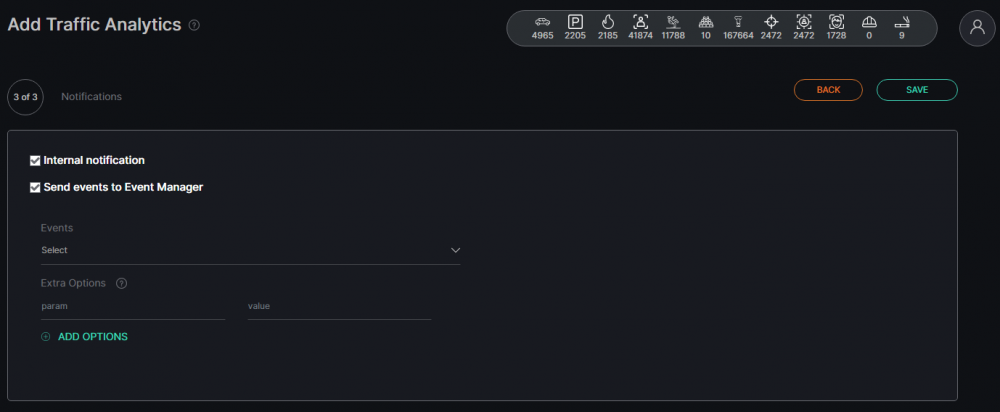
Step 3 - Notifications
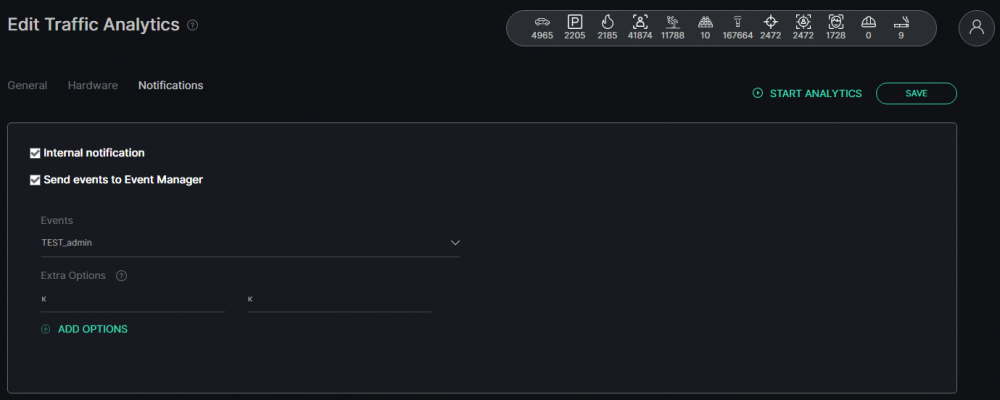
Finally, it is possible to customize Notifications.
There are two main options for sending notifications:
• If you check the box next to Internal notification, the system sends all notifications to the Events section of the module;
• If you check the box next to Send events to Event Manager, the system sends all notifications to the Event Manager and then to external resources.
Note: You can choose one of them or use both simultaneously.
If you check the box next to Send events to Event Manager, it is necessary to fill in the following fields:
| Field name | Description |
|---|---|
| Events | Select the event for which notifications will be sent from the drop-down list. |
| Extra Options | If necessary, it is possible to add additional parameters for further use when event creating. Fill in the parameter and value fields. |
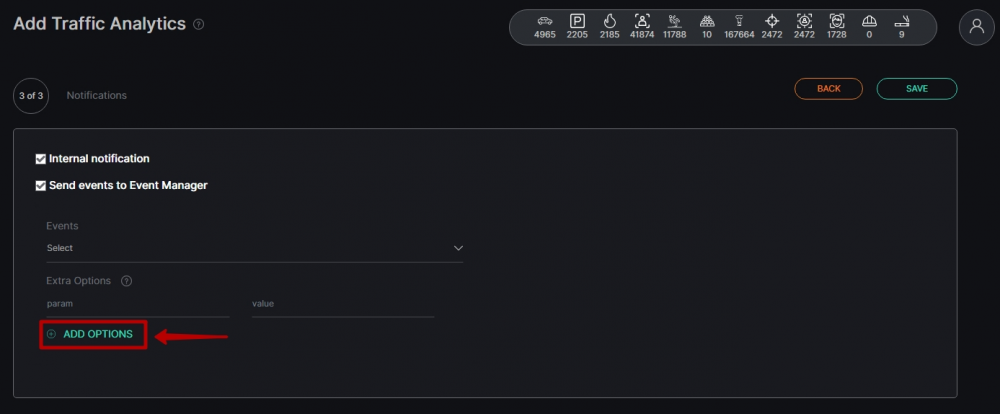
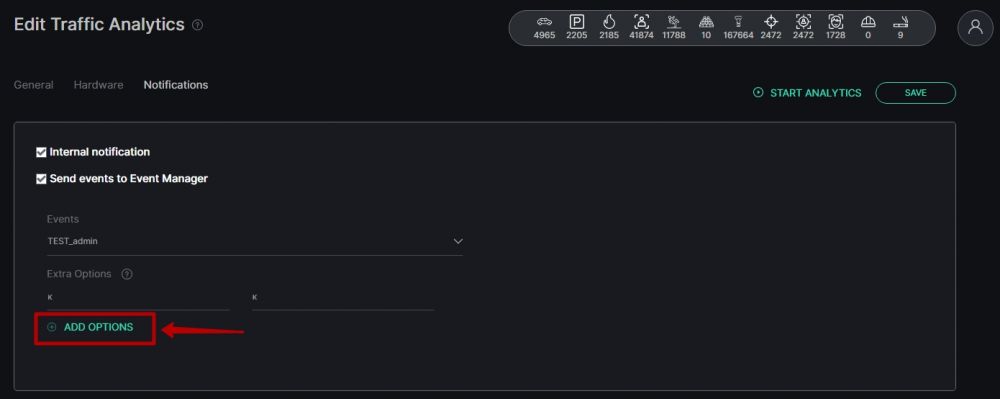
To add more parameters, click on the Add Options button.
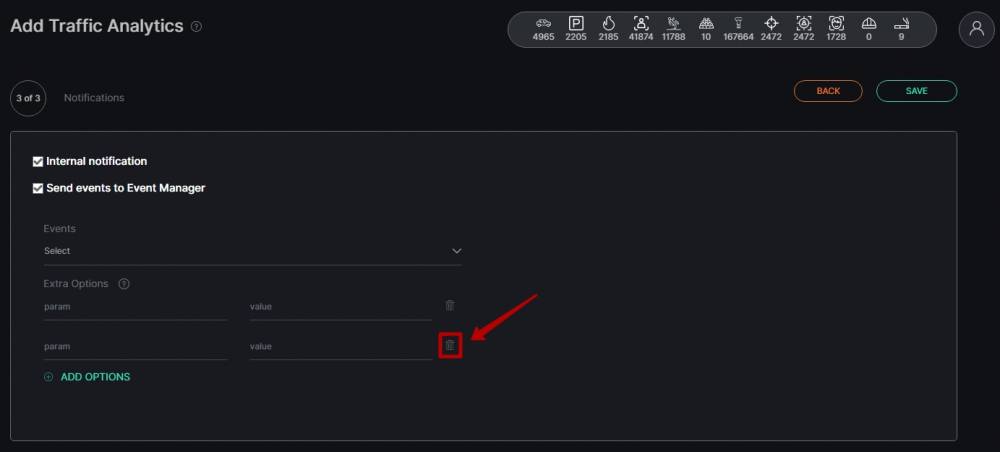
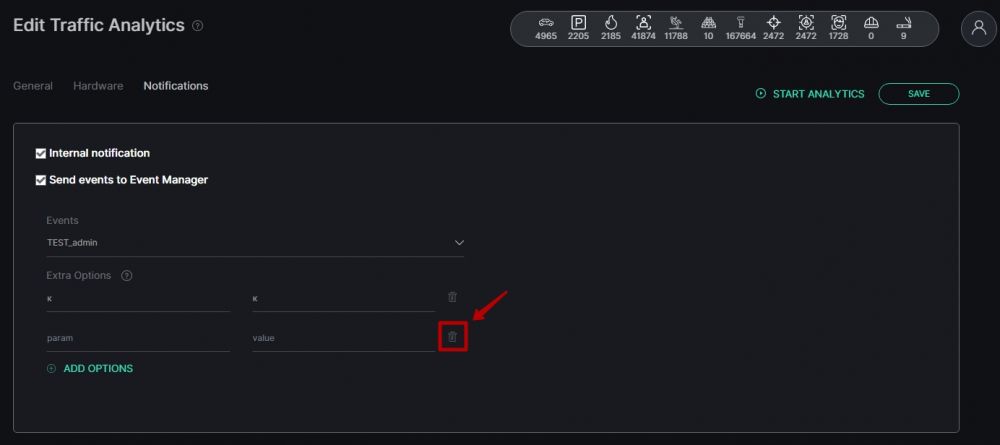
To remove parameters, click on the Delete icon.
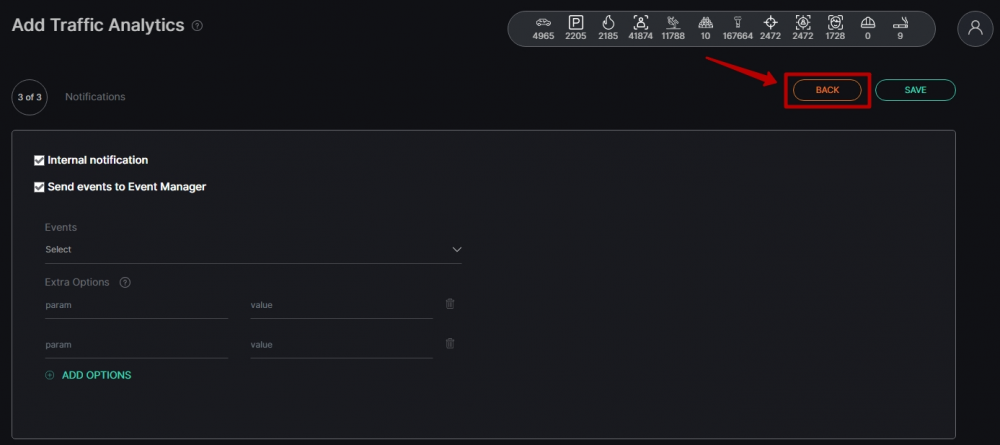
If you want to make changes to previous steps, click on the Back button in the upper right corner of the page.
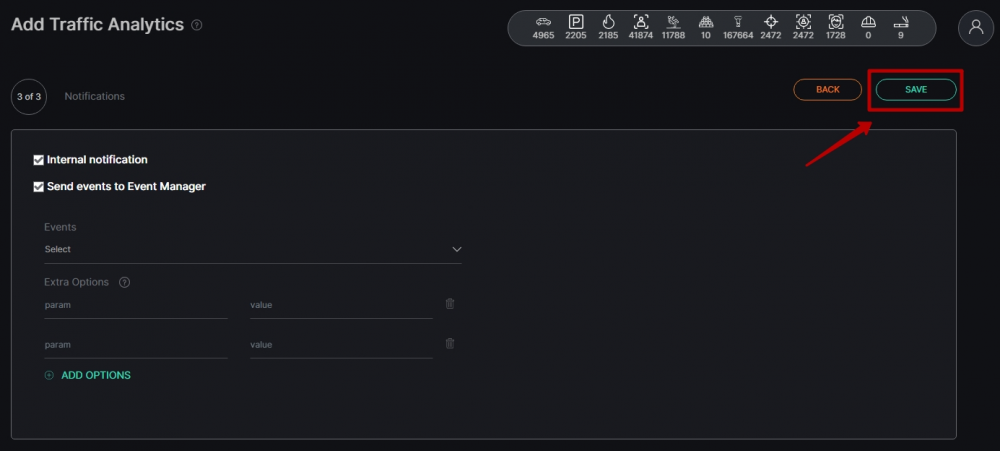
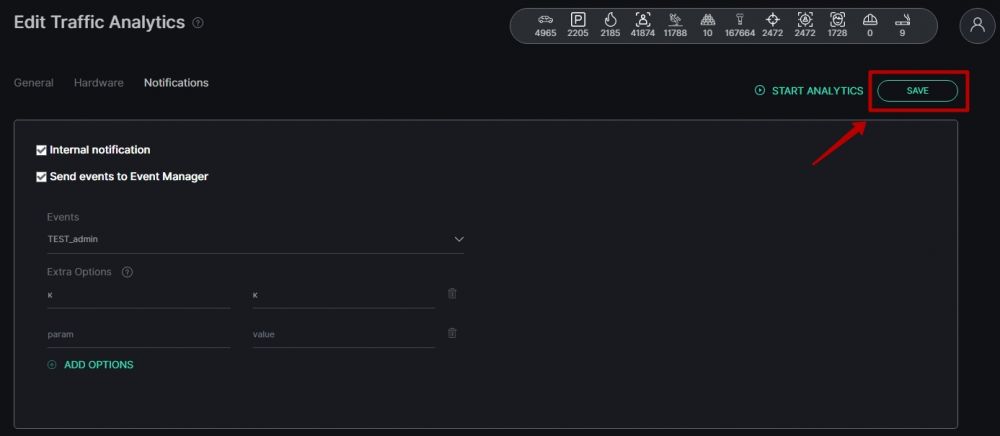
When the analytics setup is complete, click on the Save button in the upper right corner of the page to save changes and create the analytics.
Analytics Editing
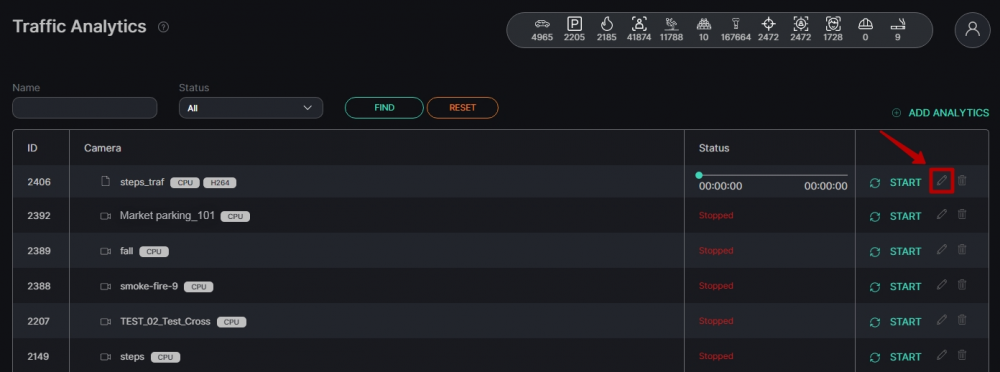
To open the Traffic analytics editing window, press the Edit button on the right side of the analytics record.
It is possible to edit the analytics if it is not running.
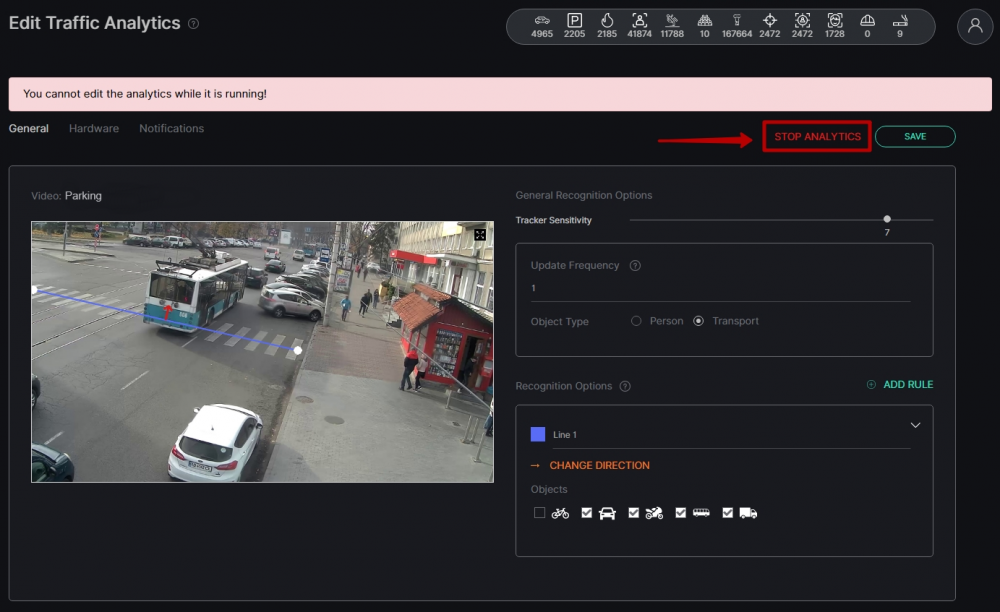
If the analytics is active at the moment, it is necessary to disable it by clicking on the Stop Analytics button in the upper right corner of the editor page.
When you click on the Stop Analytics button, the Confirmation window opens. Click Yes to confirm the analytics disable or click No to cancel the action.
Now when the analytics is disabled it is possible to make changes to it.
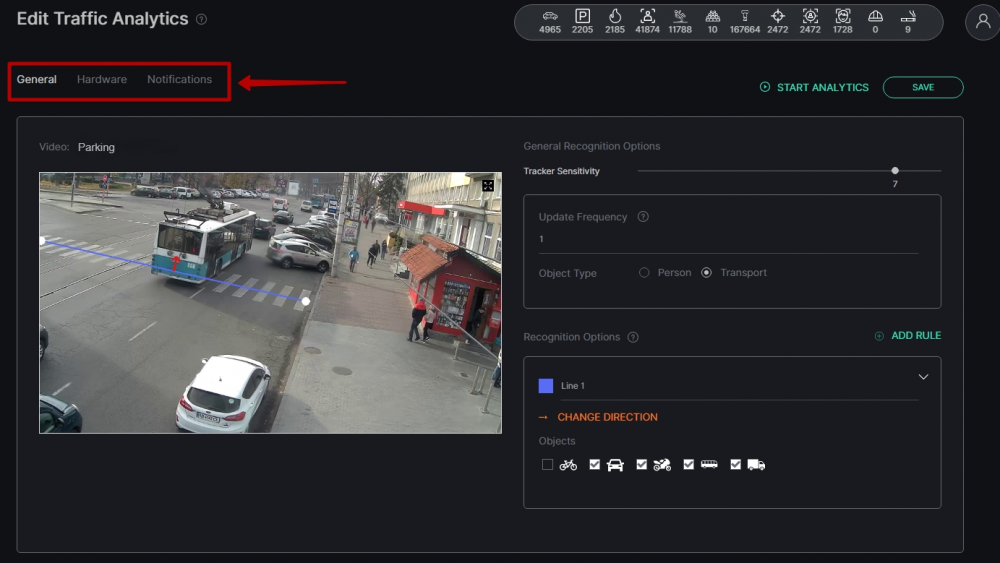
There are 3 tabs of parameters at the top of the page, similar to the steps in creating analytics - General, Hardware, and Notifications. The General tab opens first by default.
The current tab is always highlighted. You can switch among them by clicking on their names.
General Tab
At the General tab it is possible to edit the following parameters:
| Parameter | Description |
|---|---|
| Tracker Sensitivity | Move the slider to the left (to decrease) or to the right (to increase) the camera sensitivity. Possible range from 1 to 8 |
| Update Frequency | Enter the interval between analytics value updates in seconds. Possible range from 1 to 100 sec |
| Object Type | Select object type (person or transport) for traffic tracking |
| Recognition Options | Parameters on which the chosen object recognition is performed |
Recogintion Options
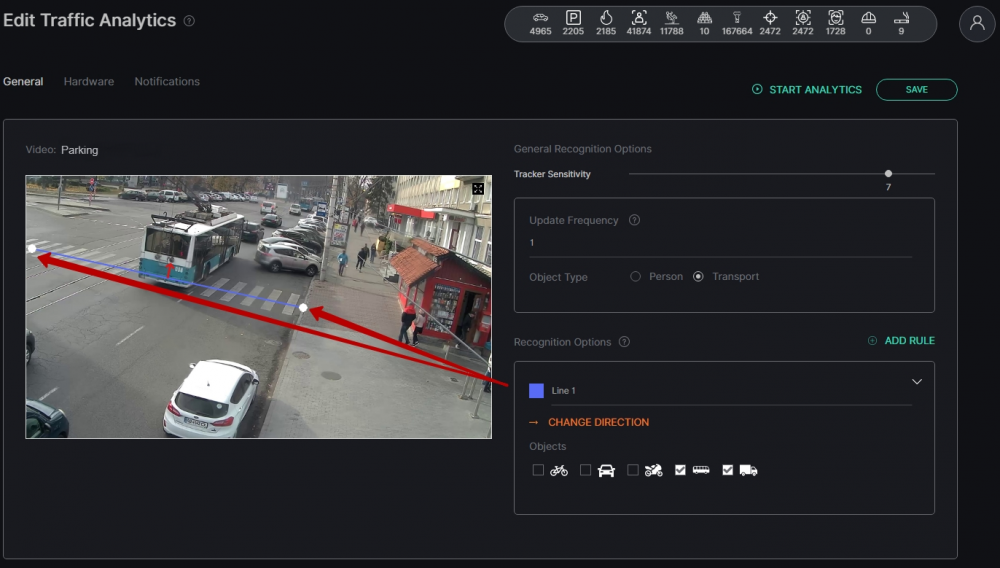
To change the line placement, move the line markers to the desired place.
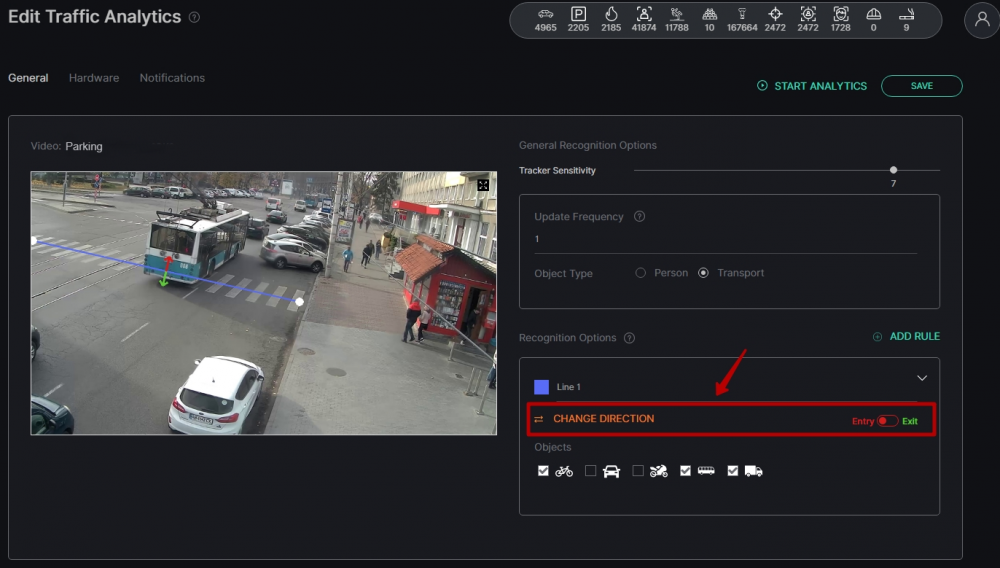
To change the traffic accounting direction, click on the Change Direction button. The arrow will change its direction after each click on the button.
If you use two-way directions - determine the direction of Entry and Exit by moving the slider to the left or right side.
Note: If you use one-way direction, the Entry/Exit slider is unavailable.
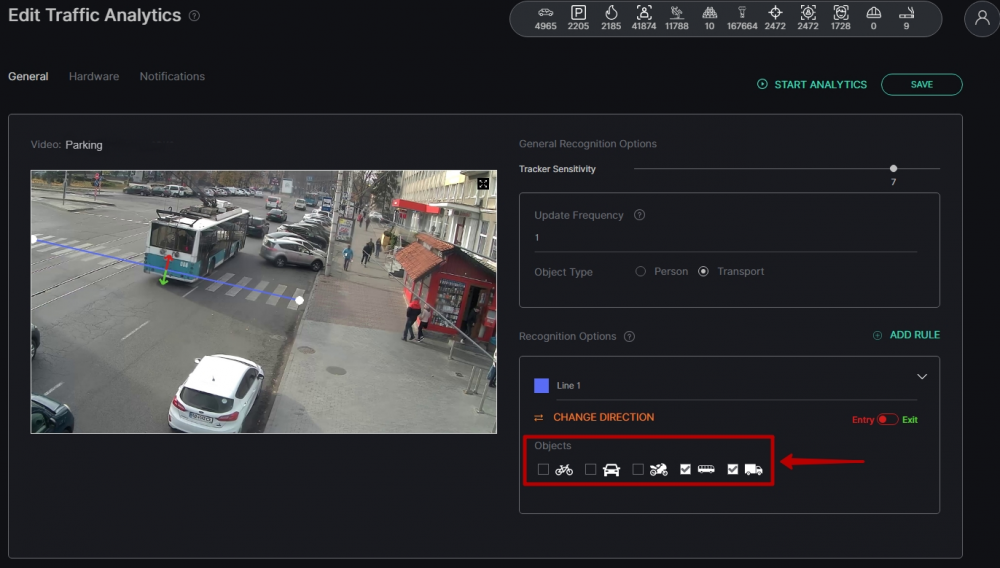
Finally, if you have chosen the Transport object type earlier, it is possible to check other boxes next to the desired objects for traffic counting in the Objects section.
Note: If you have chosen the Person object type, the section Objects is unavailable.
If you need to add more lines with different rules, click on the Add Rule button.
If you want to delete some lines, click on the Delete Rule button.
Hardware Tab
At the Hardware tab it is possible to edit the following parameters:
| Parameter | Description |
| Hardware | Select one of the technologies - CPU or GPU acceleration |
| Decoding | Select the hardware decoder from the drop-down list - CPU, Intel, Nvidia |
| Optimization | Select the optimization parameter from the drop-down list (for CPU - CPU (no optimization), Open VINO; for GPU - CUDA (no optimization), cuDNN Half (FP16), Tensor RT) |
| FPS | Enter the desired number of frames per second in the field for detection. The recommended value is 25 |
Notifications Tab
Finally, it is possible to edit Notifications.
There are two main options for sending notifications:
• If you check the box next to Internal notification, the system sends all notifications to the Events section of the module;
• If you check the box next to Send events to Event Manager, the system sends all notifications to the Event Manager and then to external resources.
Note: You can choose one of them or use both simultaneously.
If you check the box next to Send events to Event Manager, it is necessary to fill in the following fields:
| Field name | Description |
|---|---|
| Events | Select the event for which notifications will be sent from the drop-down list. |
| Extra Options | If necessary, it is possible to add additional parameters for further use when event creating. Fill in the parameter and value fields. |
To add more parameters, click on the Add Options button.
To remove parameters, click on the Delete icon.
When the analytics editing is complete, click on the Save button to save changes.
Analytics Viewing
To view Traffic analytics, press the View icon on the right side of the analytics record.
It is possible to view only Active video streams.
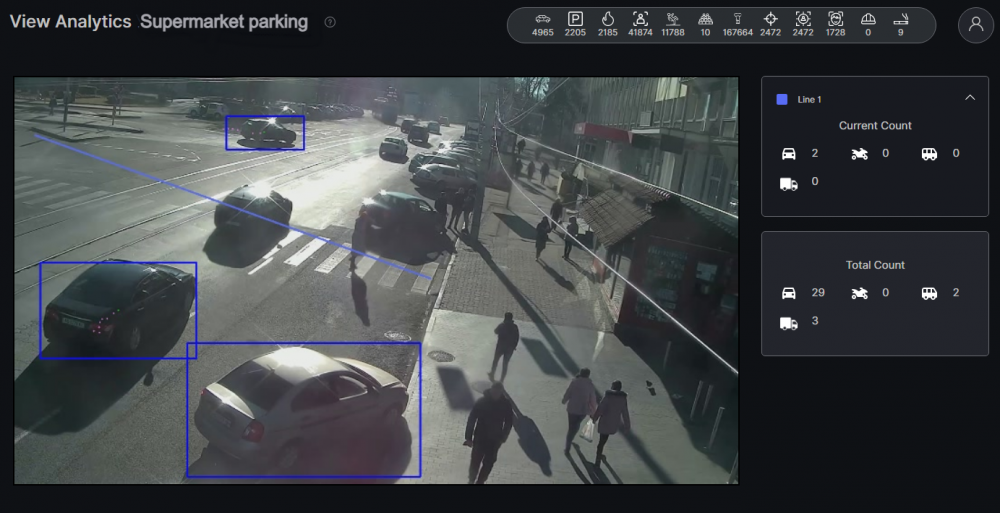
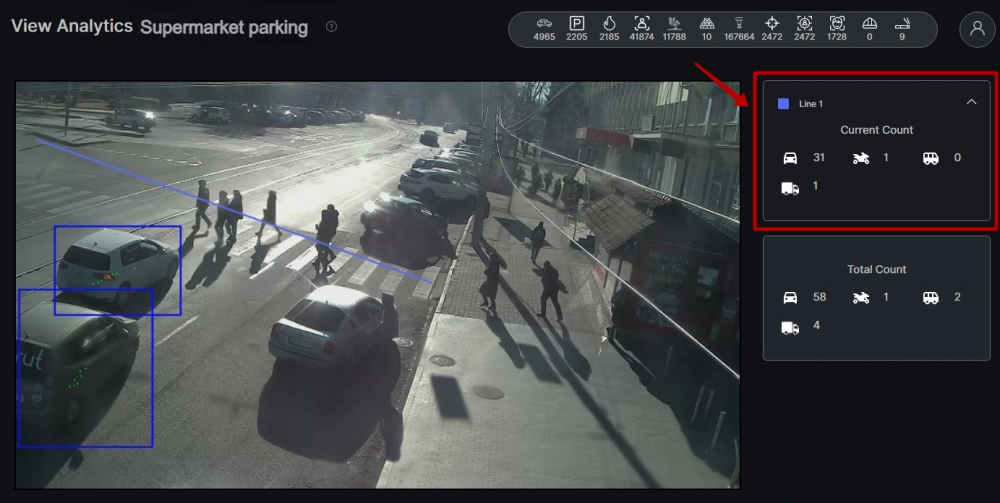
In the opened window you can view the video from the camera in real-time.
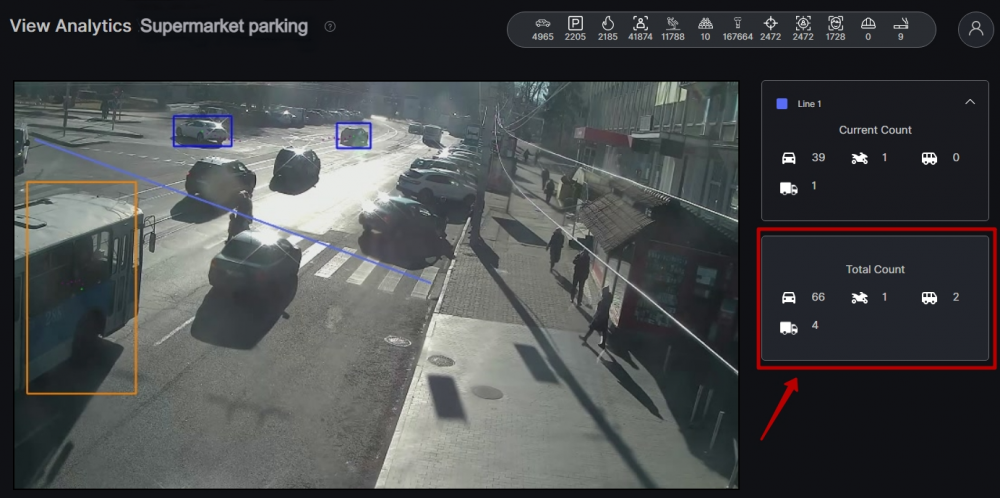
In this window, it is possible to see the traffic amount of Transport or People depending on the parameters you have set while creating/editing the analytics.
There is as many "Line"-boxes on the right side of the page as "Line"-rules were added while creating/editing the analytics. Each box contains the objects' Current Count.
And there is also one extra box with objects' Total Count. It shows the total amount of objects counted during analytics total running time.
Analytics Start and Stop
To start Traffic analytics press the Start button in the right part of the record. To stop the analytics press the Stop button.
When you click on the Stop button, the confirmation pop-up opens. Click Yes to confirm or click No to cancel the action.
Events Viewing
To view events from certain analytics, click on the corresponding icon on the right side of the record.
Analytics Deletion
To delete Traffic analytics press the Delete icon on the right side of the analytics record.
When you click on the Delete icon, the confirmation pop-up opens. Press Yes to confirm or No to cancel the deletion.
Statistics
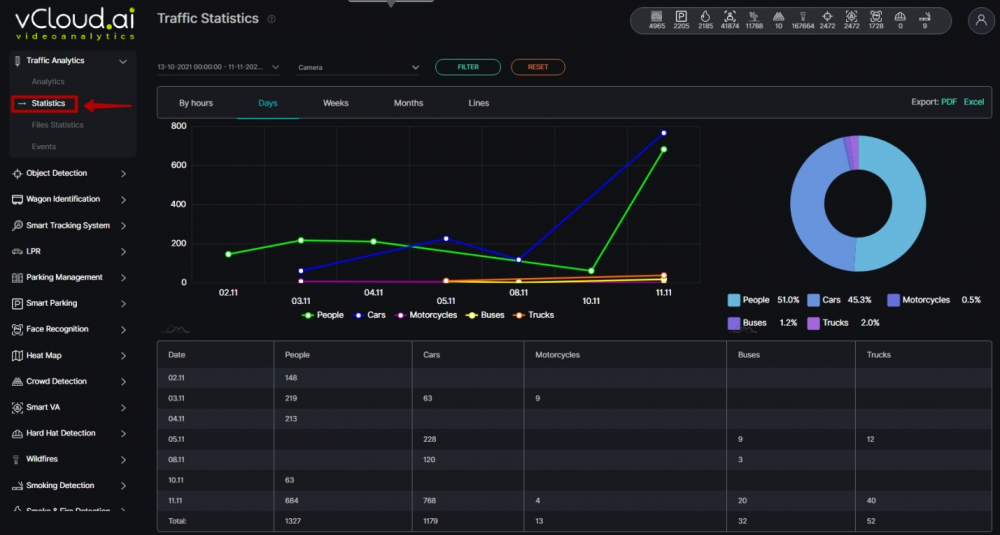
In order to view Traffic statistics, select Traffic in the left menu and pass to the Statistics section.
Traffic Statistics is designed to generate statistical reports and count the number of people or vehicles for a certain period of time.
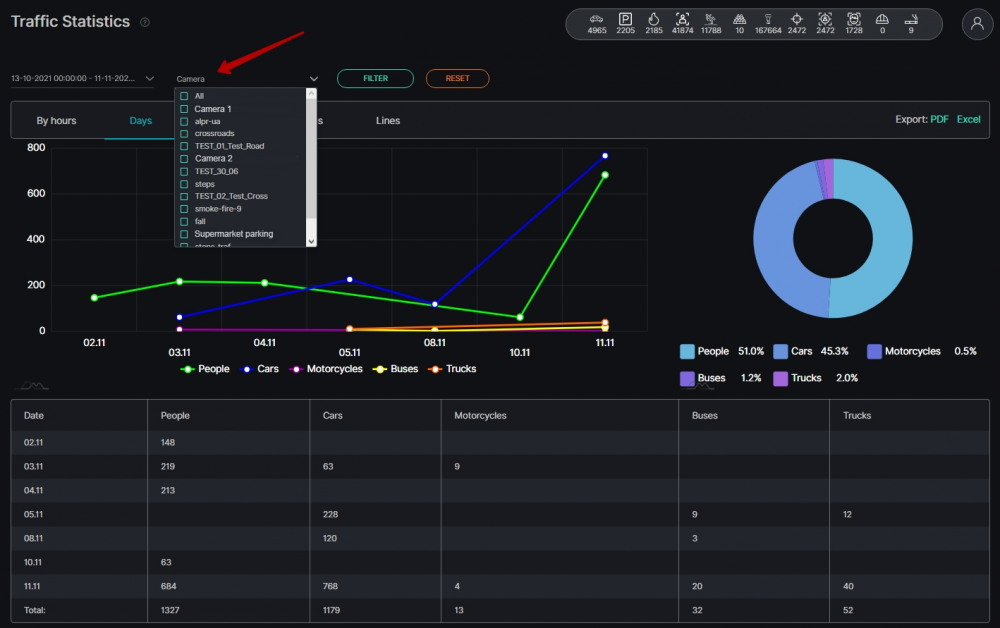
Statistics Filters
To filter statistics it is necessary to perform the following operations:
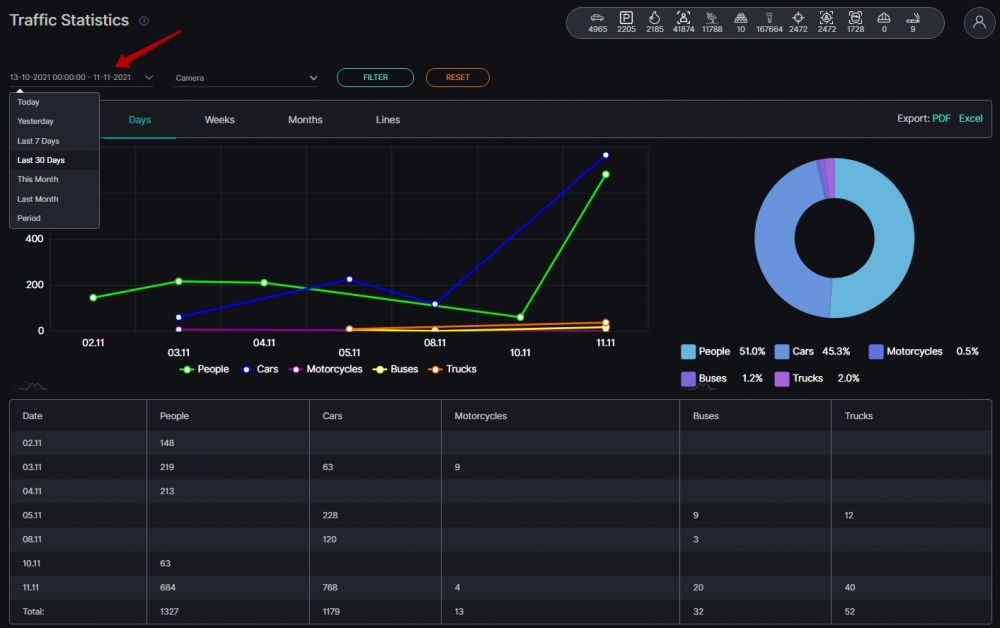
• Select a time frame on which statistics will be formed.
For the period selection it is necessary to indicate one of the values: today, yesterday, last 30 days, this month, last month, manually selected period (specify the range of days and time by means of the calendar).
• Select the camera from which the video stream is reproduced. It is possible to filter by All cameras or select only some of them.
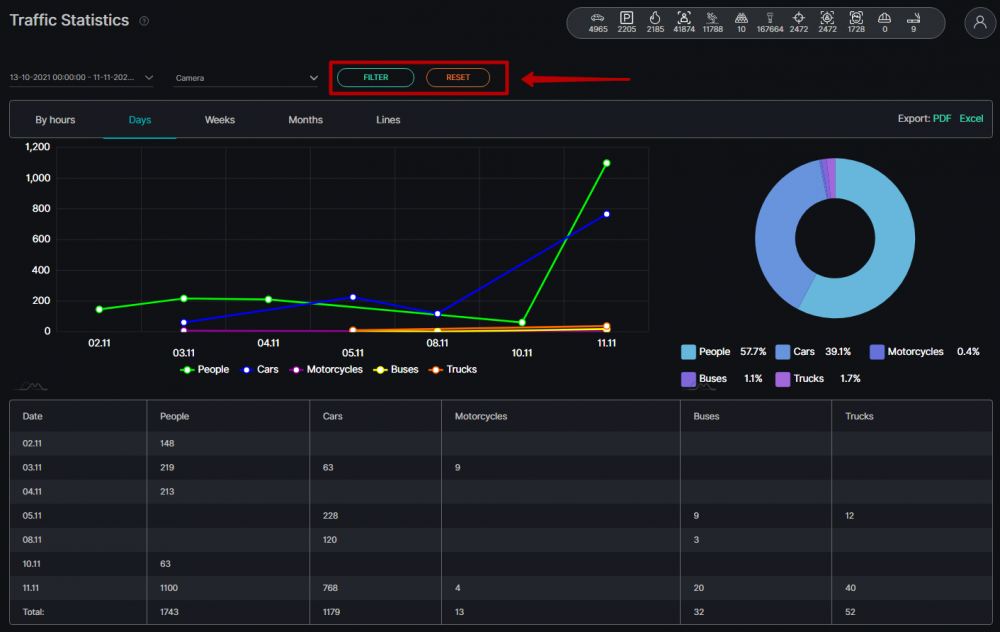
Then press the Filter button. To clear the fields click on the Reset button.
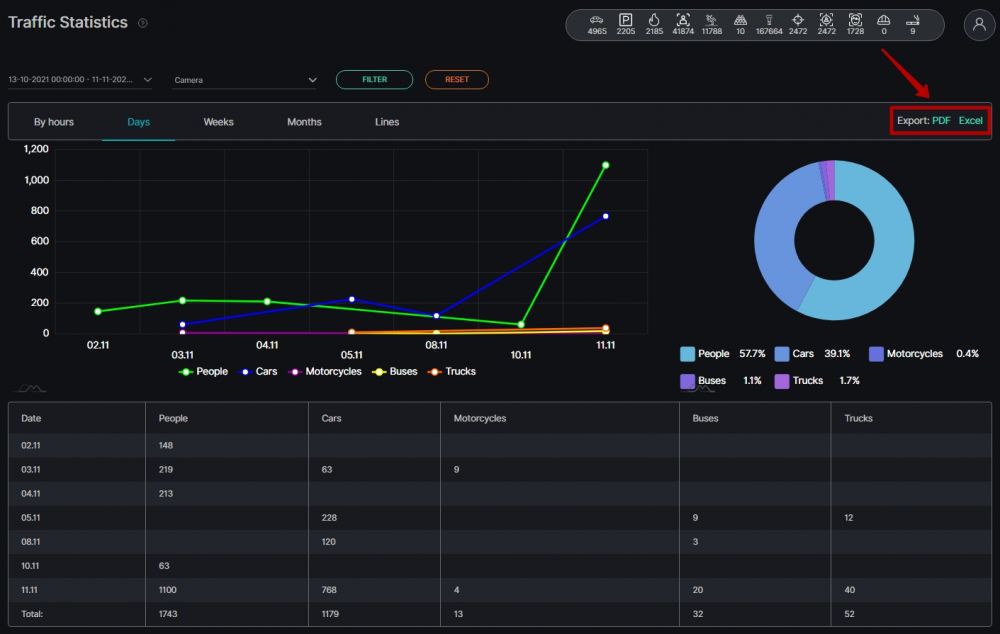
Export
It is possible to generate and download a statistical report in PDF or Excel formats.
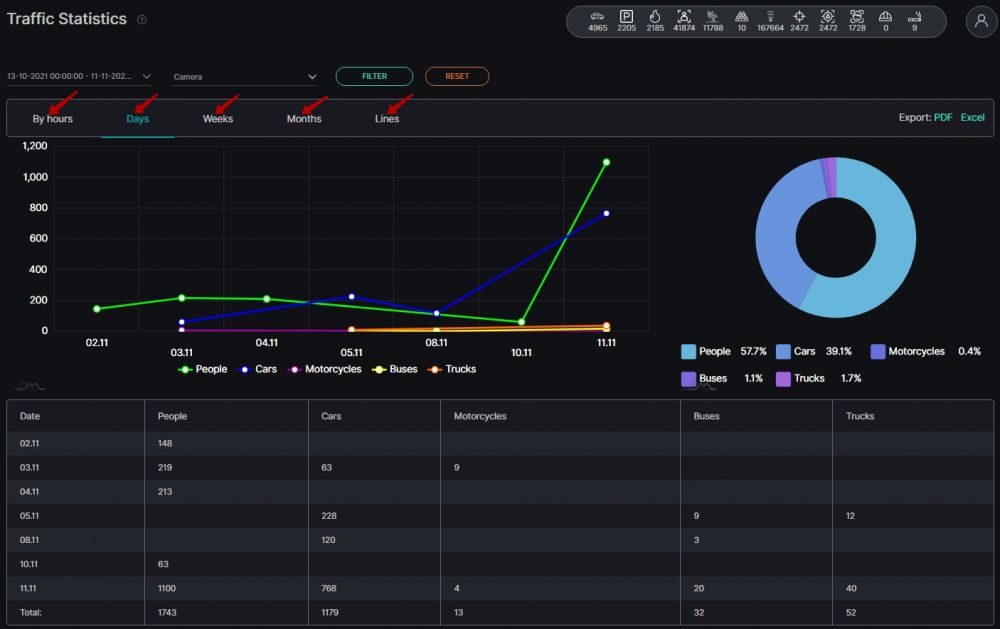
Statistics Tabs
To view statistics by hours, days, weeks, months, or lines select the corresponding tab.
By Hours Tab
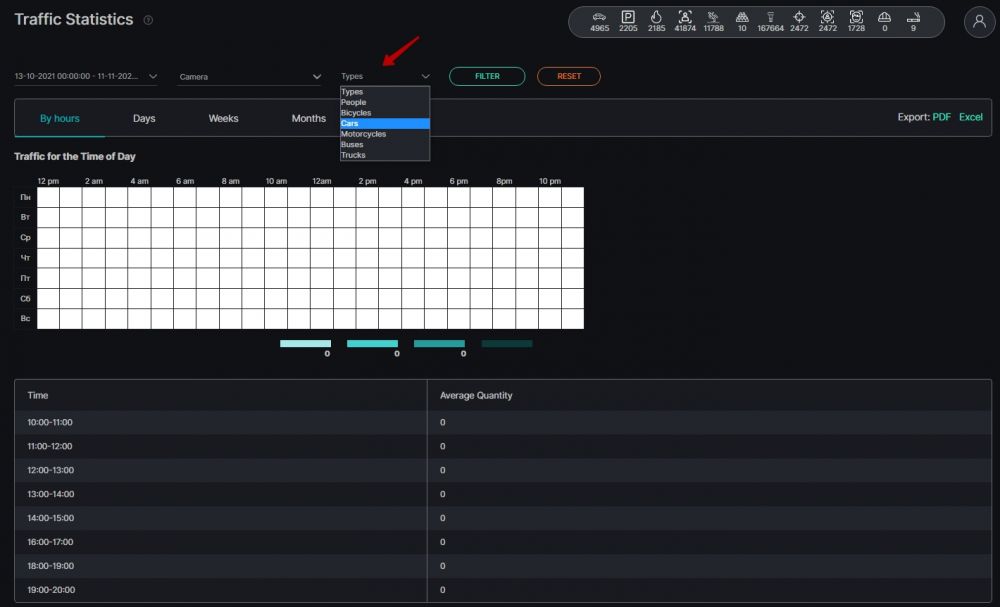
In the By hours tab, it is possible to see quantitative indicators on Transport and People with respect to hourly specification and on days of the week.
You can select the necessary type of Transport by pressing the menu Types.
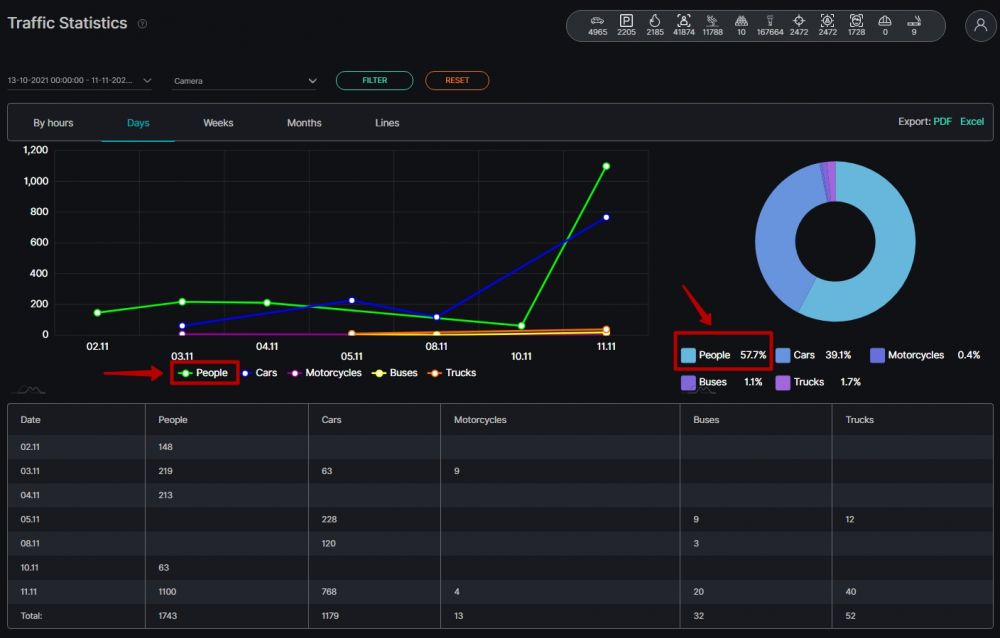
Days, Weeks, Months Tabs
In the Days, Weeks, and Months tabs, it is possible to delete the unnecessary elements from the diagram, pressing the object name under the diagram or the pie chart.
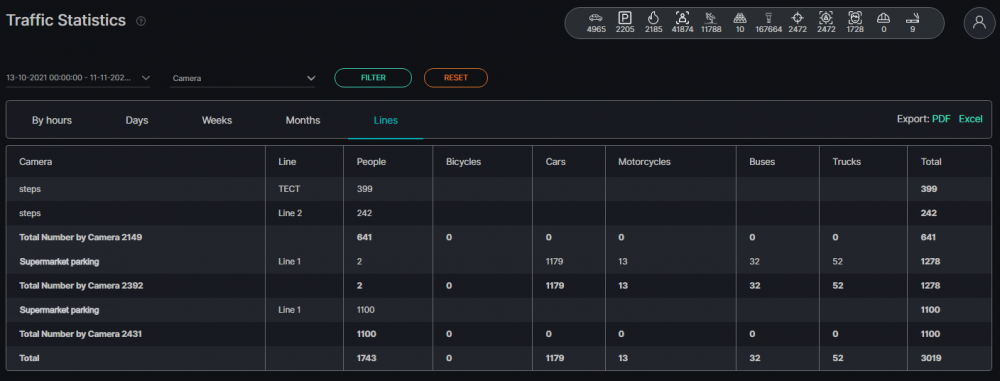
Lines Tab
In the Lines tab, it is possible to view the quantitative specifications on types of Transport and People concerning the lines tied to analytics cameras.
Files Statistics
If you have run analytics with a video file instead of the video stream, you can view the results in the Files Statistics section in the Traffic module.
Filter
Filter fields are located at the top of the screen.
| Filter fields | Parameter |
|---|---|
| File | You can choose the required file name from the drop-down list |
| Start, min | Fill in the start point of a video stream in minutes |
| End, min | Fill in the endpoint of a video stream in minutes |
| Interval, min | Fill in the interval between checkpoints in minutes |
Enter required parameters and press the Filter button to view the results. To clear the fields click on the Reset button.
Results
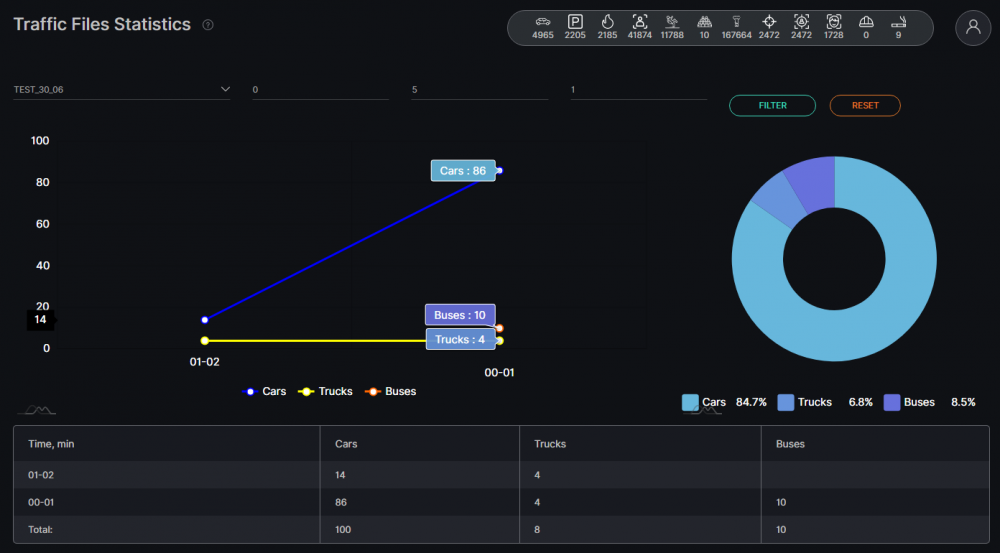
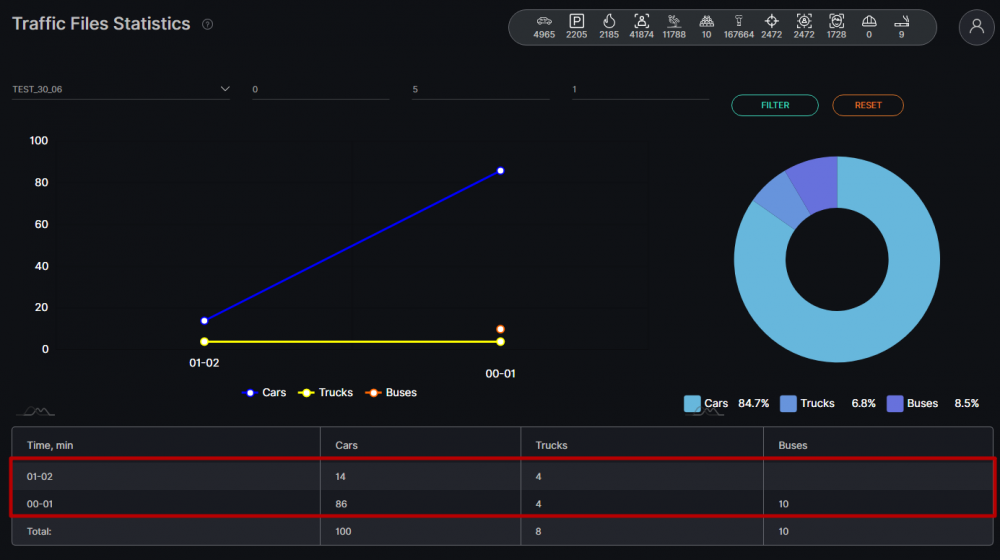
The statistics results will be shown in a table and in graphs.
You can move the mouse cursor to the checkpoint on a graph you are interested in and see how many objects were recognized by the analytics during this period.
Table
You can see the same data for the same period of time in the table below.
The table of files statistics consists of the following columns: Time, min, People, Bicycles, Cars, Motorcycles, Trucks, Buses.
The amount of these fields depends on the current analytics parameters you have selected.
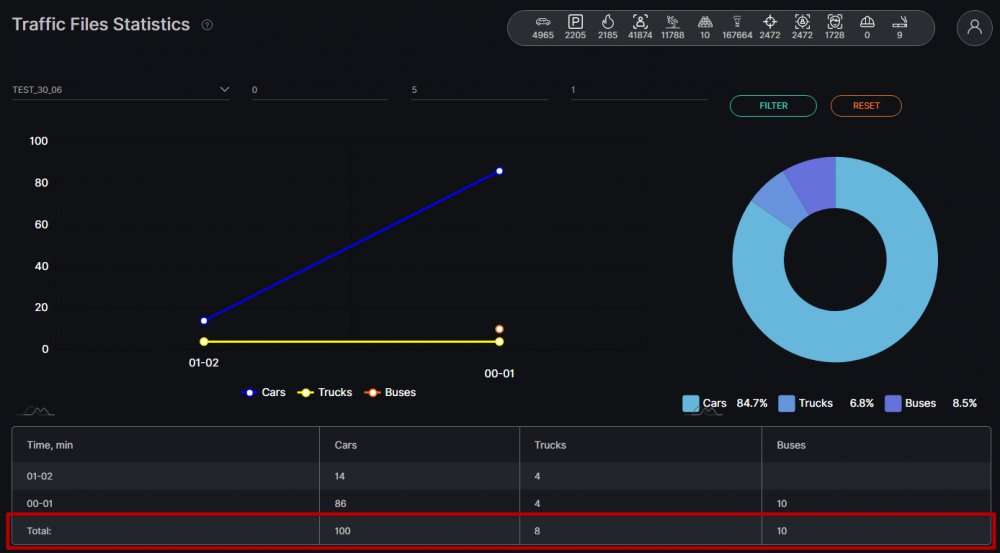
There is a Total line at the bottom of the table, which shows the total amount of objects recognized by the analytics for the selected time frame.
Events
To view the Traffic Events notifications, select Traffic Analytics in the left menu and pass into the Events section.
Events Search
There is a traffic event search field at the top of the page.
Here you can filter traffic events by the following parameters:
| Field name | Description |
|---|---|
| Time Frame | Click on the field and select the desired time frame |
| Camera | Press on the field and select the camera you want to receive notifications for from the drop-down list |
| Object Type | Press on the field and select the desired object types - Person, Bicycle, Car, Motorbike, Bus, Truck |
Press Search to display the search results. Press Reset to clear the input fields.
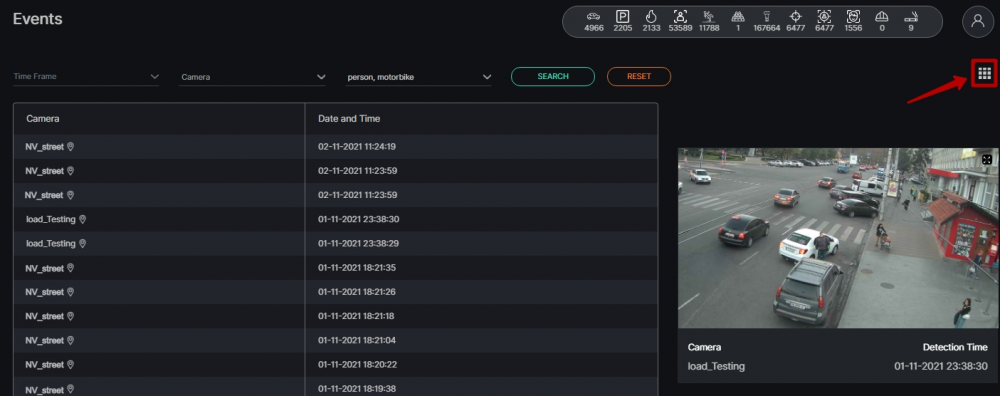
Events View
To go to the view in the table format, press the corresponding icon in the upper-right corner.
To return to the grid format, press the corresponding icon in the upper-right corner again.
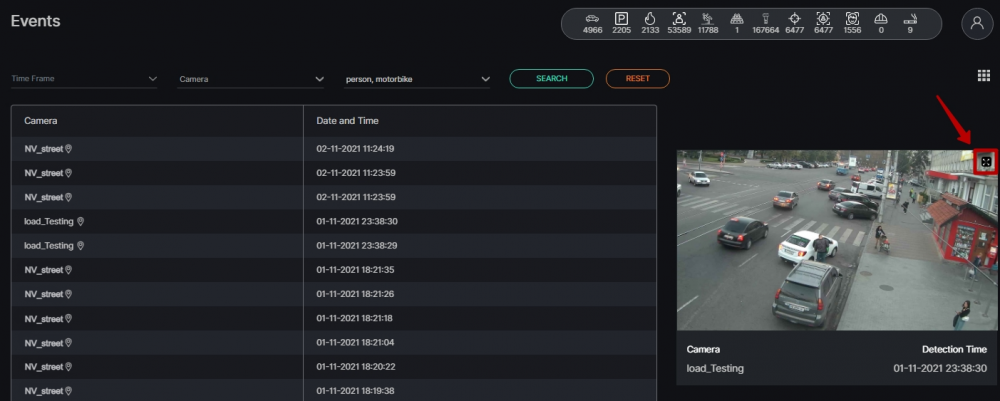
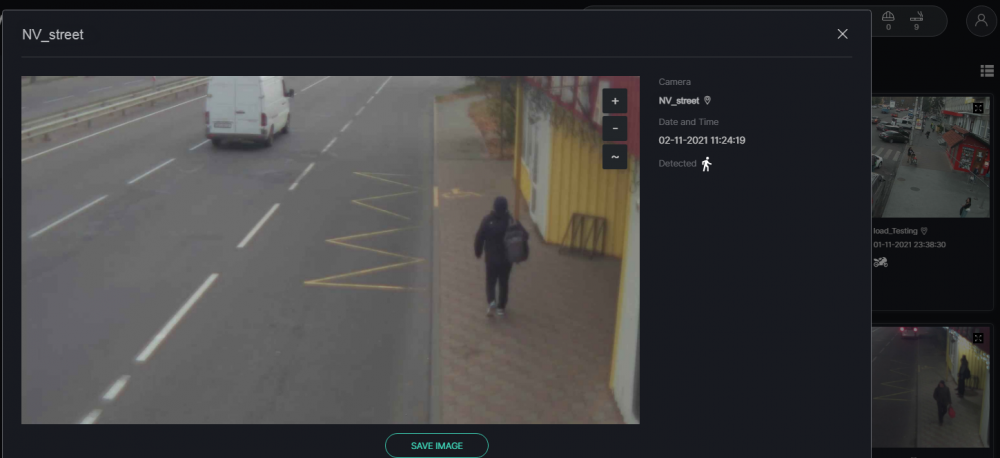
Frame View
To take a closer look at the frame with an object, press the enlargement icon.
Press "+" to Zoom in or "-" to Zoom out the frame. Press "~" to return the frame to the default size.
Camera Compatibility
The solution is compatible with all cameras, that return the RTSP stream.
Camera Installation Requirements
Static and reliable camera mount
• Top view/perspective, top view
• Avoid refocusing and image sharpness changes
• There should be no overexposures and glare in the frame
• Detected objects are not overlapped by other objects
Object Size Requirement
• Person size min: 45x90px; recommended: 60x90px
• Vehicle size min: 45x45px; recommended: 90x90px


