Power BI
VCA.VCLOUD.AI Power BI setup guide
Data acquisition
To start work with Power BI you need to load data according to which it will be possible to create reports.
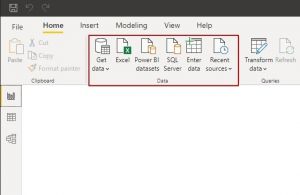
For this purpose find the section "Data" in the toolbar.
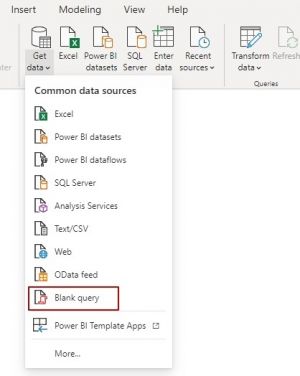
Press on "Obtain data" and choose "Empty request".
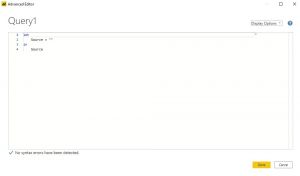
In the opened window press "Advanced Editor".
Enter request.
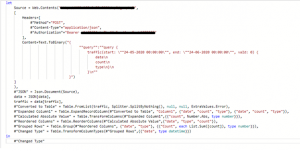
For creation of request the Web.Contents function is used ()
It is necessary to specify by the first argument of this function the resource from which data will be loaded.
The template looks so: "http://vca.vcloud.ai:2001/api/graphql"
On the screenshot the example of input of the address is shown above.
The following argument which we give to functions is in braces "[]" after the comma.
In the beginning it is necessary to prescribe Headers of HTTP of requests:
# ”Method” – this field needs to appropriate POST value
#  "Content-Type" – this field needs to appropriate application/json value.
# "Authorization" – for authorization is used by Bearer authorization, the token can be received it is possible in the system. For this purpose come into Settings-> the General and copy Api Token, it and needs to be entered.
Further it is necessary to create request. The problem of request is to choose necessary data for work. The request is written in the GraphQl language. The template of request looks so:
Content=Text.ToBinary (" {
				""query"": ""query { <type of request> {
			<pole1>/n
			<pole2>/n
			…….
                                       }\\n""
					 }")
Parameters:
start are the beginnings of the temporary period on which selection of records undertakes. Accepts the Date type start registers in the format ": \""DD-MM-GGGG of ChCh: MM: CC \"""
end is the end of the temporary period on which selection undertakes. Accepts the Date type start registers in the format ": \""DD-MM-GGGG of ChCh: MM: CC \"""
vaId is number of analytics. To choose everything analysts it is possible to specify 0 value or not to specify this parameter. Accepts the Int type and vaId registers in the format ": <id of analytics (stream)>".
streamId is number of the camera. To choose all cameras it is possible to specify 0 value or not to specify this parameter. Accepts the Int type and streamId registers in the format ": <id of the stream>".
alerted accepts Boolean values. In the case exposure of true value only records of persons on which there were notices recover (those that in the Events tab in the system). At exposure of false value all records of persons will be sent. alerted registers in the format ": <Boolean value>".
limit is used for restriction of number of records. In this parameter the maximum number of records which will be returned by request is entered. If to pass this parameter, then will return 100 records. Accepts the int type and limit registers in the format ": <number of records>"
offset allows to pass the specified quantity of lines before removing results of request. Accepts the int type and offset registers in the format ": <the number of the missed records>".
Types of requests are given below:
type Query {
traffic (start: Date, end: Date, vaId: Int = 0): [Traffic]
alpr (start: Date, end: Date, streamId: Int = 0): [PlateStat]
alprAlerts (start: Date, end: Date, streamId: Int = 0): [AlertStat]
person (start: Date, end: Date, streamId: Int = 0, alerted: Boolean = false, limit: Int = 100, offset: Int = 0): [Person]
personNotification (start: Date, end: Date, limit: Int = 100, offset: Int = 0): [PersonNotification]
}
In Square brackets after each type of request types which this request addresses are shown. In each type the set of fields which can be used.
To choose the necessary fields it is necessary to specify them by the principle that it is stated above.
Available fields by types of request are given below:
scalar Date
enum TrafficType {
people
bike
 car
motorcycle
bus
truck
}
enum Gender {
male
female
}
type Traffic {
va_id: Int
date: Date
line: Int
count: Int
type: TrafficType
direction: Int
directionOne: Int
directionTwo: Int
}
type PlateStat {
stream_id: Int
date: Date
total: Int
countNumbers: Int
countMakeModel: Int
countBoth: Int
}
type AlertStat {
key: String
total: Int
createdCount: Int
foundUnique: Int
foundCount: Int
closedCount: Int
}
type Person {
alerted: Boolean
streamId: Int
date: Date
age: String
gender: Gender
faceImage: String
frameImage: String
box: String
}
type PersonNotification {
name: String
age: String
gender: Int
distance: Float
date: Date
status: Int
box: String
streamId: Int
detected: String
detectedFrame: String
detectedObject: String
}
In the following part it is necessary to create the received JSON in the table with which Power bialready to work. The code is written in the Power Query M language. The guide on use the Power Query M language you can find having followed the link: https://docs.microsoft.com/en-us/powerquery-m/
The principle of writing is as follows:
- ”<name” the name of the field is written in such format. The name can be any, but it is desirable that it somehow described content. Everything that is written in such format influences the final table.
The value after the sign "=" is appropriated to Paul. For values it is possible to use ready functions of the Power Query M language.
#”JSON” = Json.Document(Source),
Data = (JSONdata)
traffic = data(traffic)
In the code that above, is described to the converted of the JSON document.
Everything that goes below - it is forming of the table with which Power bi can work.
After input of request press the button "Ready".
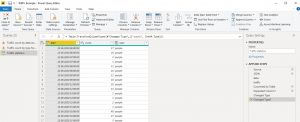
In the editor the table with data will appear.
In the right part you can change parameters of request.
In Properties you can change the name.
To add the description of request press "All properties".
In "The applied steps" you can see all changes that happened to the table.
For this purpose, that you will see the condition of the table on the certain step, press it.
To keep the obtained data, press "Close and Apply" in the toolbar:
Creation of visual elements
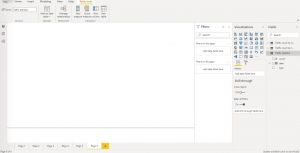
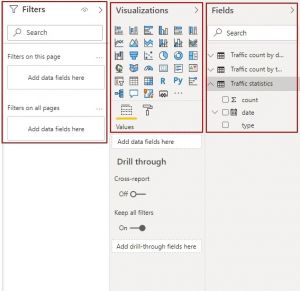
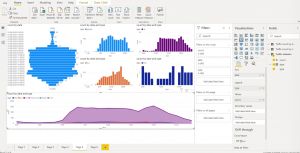
After closing of the editor you will pass to the page of creation of the report. At successful request in the right part of the area fields will be displayed.
For creation of the chart it is necessary to choose in the section visualization the visual element (the chart, the schedule, the histogram) and to note fields which shall be displayed in the visual element. Undressed filters to create the condition for the choice of elements– it allows to reduce quantity of elements for display.
After the choice of the visual element it will appear in working area. After the choice of fields and filtration the visual element will display data in the necessary format.
For viewing of the table with data execute transition to the page of data having pressed the badge in the left part of the screen:
Having pressed icons opening of the list in the name of fields you can choose necessary data and sort them.
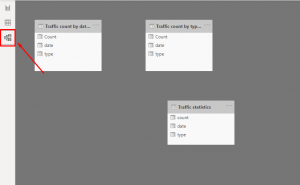
For this purpose to prescribe communication between tables pass to the page of model, having pressed the icon in the left part:
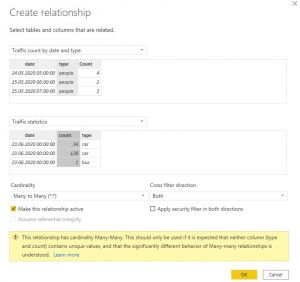
To open the window creation of communication:
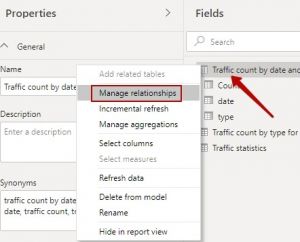
- 1. Press the badge at the top of the table or in the partition of the field right-click on the name of the table
- 2. Press "Manage relationships".
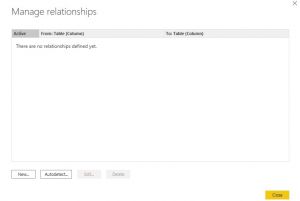
- 3. In the opened window press "Create communication". In this window all existing communications will be shown
- 4. Choose necessary tables, specify fields and frequency rate. Press "Ok".
If everything is made correctly, then communication between tables will appear.
