VCloud.ai Hard Hat Detection Module
Main functionality
- Recognition and notification of employees of production facilities, workshops or factories, construction sites in the workplace without a hardhat.
- Data storage and transmission on violations of hardhats wearing regime.
- Monitoring the level of security at construction or industrial facilities.
Product Description
The Hard Hat Detection module is designed for rapid response to cases of non-compliance with safety regulations.
Hard Hat module can be used for:
- Prevent injuries in production or construction;
- Monitoring the compliance with safety rules in places where equipment is used and installation works are performed;
- Control of discipline on the construction site or at the places of loading/unloading of raw materials.
System Requirements
It is necessary to have the minimum system requirements for one video stream for Hard Hat Detection module installation on GPU as in the table below. For information on a bigger quantity of video streams address the official distributor of the VEZHA products.
| PARAMETER | RECOMMENDED VALUE |
| CPU | Intel Core i5-5575 or higher |
| RAM | 2 GB RAM |
| GPU | NVIDIA 1030 |
| Places for archive | up to 3GB per day (~4.5k detections) |
| Operating system | Ubuntu 20.04 |
Analytics
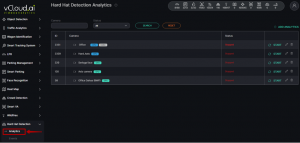
To open the Hard Hat Detection analytics, select Hard Hat Detection in the left menu and pass to the Analytics section.
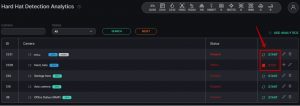
In the Analytics section, you can customize analytics. The page displays a list of analytics with the status and the ability to add, edit, view, or delete analytics.
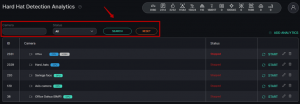
There is a search field at the top of the page. Here you can filter analytics by the following parameters:
| Field name | Description |
| Camera | Analytics name or part of a name can be entered in this field |
| Status | Select the Analytics status from the drop-down list - All, Active, or Stopped |
To start the search click on the Search button. To clear the fields click on the Reset button.
Analytics Adding
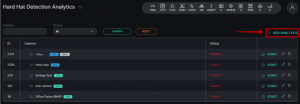
In order to add a new Hard Hat Detection analytics, press Add Analytics in the upper right corner of the page.
The Hard Hat Detection analytics setup process consists of 3 Steps.
Step 1 - General
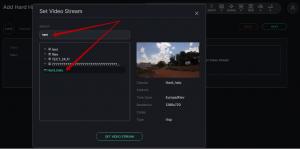
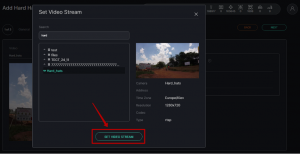
First of all, it is necessary to select a video stream. Click on the Video field and select the camera name from a list.
You can also enter the part of the camera name in the Search field to find the necessary video stream faster.
On the right side of the window, you can see the video stream preview and information about Camera name and Address, Time Zone, Resolution, Codec, and Type.
When the video stream is selected press the Set Video Stream button.
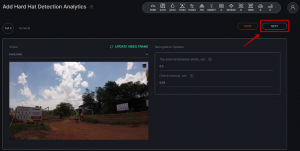
By pressing the Update Video Frame button you can see a frame in real-time in the field of frame addition.
It is possible if a video stream was selected
To add analytics it is necessary to set up the following parameters:
| Field name | Description |
| The interval between alerts, sec | The frequency with which the system will check for the notification. The possible range is from 0.5 to 300 s. The recommended value is 0.5 s |
| Check interval, sec | The frequency with which the system will check for the presence of a hardhat. The possible range is from 0.04 to 30 s. The recommended value is 0.04 s |
To pass to the next step, click on the Next button in the upper right corner of the page.
Step 2 - Hardware
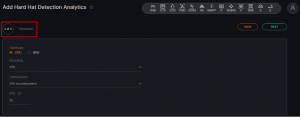
Now it is time to customize Hardware options. System users can change the following parameters:
| Parameter | Description |
| Hardware | Select one of the technologies - CPU or GPU acceleration |
| Decoding | Select the hardware decoder from the drop-down list - CPU, Intel, Nvidia |
| Optimization | Select the optimization parameter from the drop-down list (for CPU - CPU (no optimization), Open VINO; for GPU - CUDA (no optimization), cuDNN Half (FP16), Tensor RT) |
| FPS | Enter the desired number of frames per second in the field for detection. The recommended value is 25 |
When all necessary parameters are selected, go forward to the last step by clicking on the Next button in the upper right corner of the page.
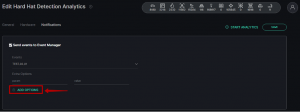
Step 3 – Notifications
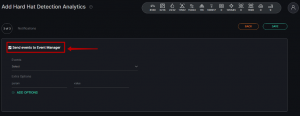
Finally, it is possible to customize Notifications.
For this purpose check the box next to Send events to Event Manager. The system will send all notifications to the Event Manager and then to external resources.
Then it is necessary to fill in the following fields:
| Field name | Description |
| Events | Select the event for which notifications will be sent from the drop-down list. |
| Extra Options | If necessary, it is possible to add additional parameters for further use when event creating. Fill in the parameter and value fields. |
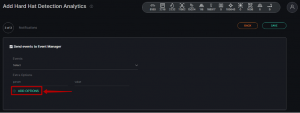
To add more parameters, click on the Add Options button.
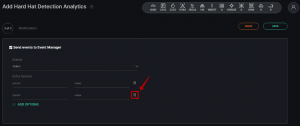
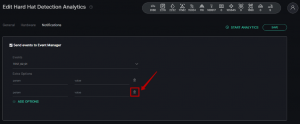
To remove parameters, click on the Delete icon.
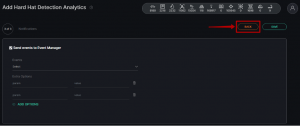
If you want to make changes to previous steps, click on the Back button in the upper right corner of the page.
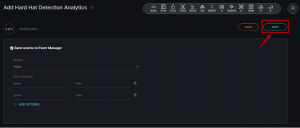
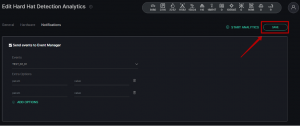
When the analytics setup is complete, click on the Save button in the upper right corner of the page to save changes and create the analytics.
Analytics Editing
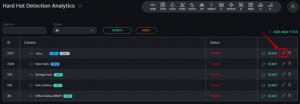
To open the Hard Hat Detection analytics editing window, click the Edit button on the right side of the analytics record.
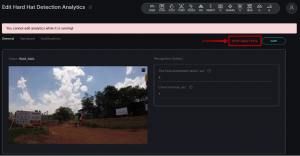
It is possible to edit the analytics if it is not running.
If the analytics is active at the moment, it is necessary to disable it by clicking on the Stop Analytics button in the upper right corner of the editor page.
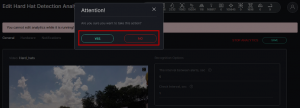
When you click on the Stop Analytics button, the Confirmation window opens. Click Yes to confirm the analytics disable or click No to cancel the action.
Now when the analytics is disabled it is possible to make changes to it.
There are 3 tabs of parameters at the top of the page, similar to the steps in creating analytics - General, Hardware, and Notifications. The General tab opens first by default.
The current tab is always highlighted. You can switch among them by clicking on their names.
General Tab
At the General tab it is possible to edit the following parameters:
| Field name | Description |
| The interval between alerts, sec | The frequency with which the system will check for the notification. The possible range is from 0.5 to 300 s. The recommended value is 0.5 s |
| Check interval, sec | The frequency with which the system will check for the presence of a hardhat. The possible range is from 0.04 to 30 s. The recommended value is 0.04 s |
Hardware Tab
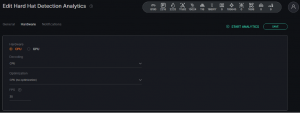
At the Hardware tab it is possible to edit the following parameters:
| PARAMETER | DESCRIPTION |
| Hardware | Select one of the technologies - CPU or GPU acceleration |
| Decoding | Select the hardware decoder from the drop-down list - CPU, Intel, Nvidia |
| Optimization | Select the optimization parameter from the drop-down list (for CPU - CPU (no optimization), Open VINO; for GPU - CUDA (no optimization), cuDNN Half (FP16), Tensor RT) |
| FPS | Enter the desired number of frames per second in the field for detection. The recommended value is 25 |
Notifications Tab
At the Notifications tab it is possible to edit values in the following fields:
| FIELD NAME | DESCRIPTION |
| Events | Select the event for which notifications will be sent from the drop-down list. |
| Extra Options | If necessary, it is possible to add additional parameters for further use when event creating. Fill in the parameter and value fields. |
To add parameters, click on the Add Options button.
To remove parameters, click on the Delete icon.
When the analytics editing is complete, click on the Save button in the right upper corner of the editor page to save changes.
Analytics Viewing
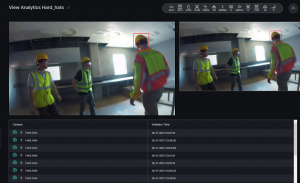
To view a Hard Hat Detection analytics, press the View icon on the right side of the video stream field.
It is possible to view only Active video streams.
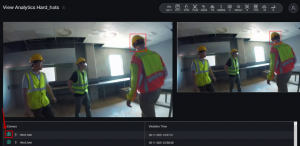
In the opened window, you can view the video from the camera in real-time.
There are violation records in the table below, which includes Camera, and Violation Time columns.
| COLUMN NAME | DESCRIPTION |
| Camera | Here you can look at the camera location and a frame of violations of the hardhats wearing regime |
| Violation Time | The time the camera detects a violation of hardhats wearing regime |
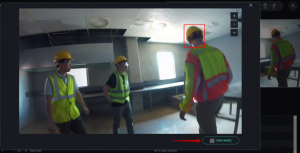
Press on the Frame icon to look closer at the detected violation of the hardhats wearing regime.
To download an image of the violation of the hardhats wearing regime, press Save image.
Analytics Start and Stop
To start analytics, press the Start button on the right side of the analytics field. To stop analytics, press the Stop button.
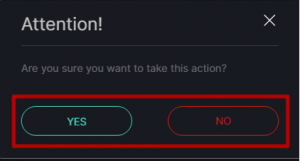
When you click on the Stop button, the confirmation window opens. Click Yes to confirm or click No to cancel the action.
Analytics Deletion
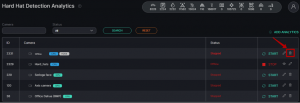
To delete analytics, press the Delete icon on the right side of the analytics field.
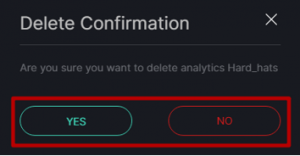
In opened window press Yes to confirm the deletion or No to cancel the deletion.
Events
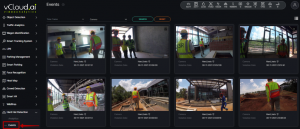
To view the history of security violations, select Hard Hat Detection in the left menu and pass into the Events section.
Events Search
There is an event search field at the top of the page.
| Search field | Parameters |
| Time Frame | Press on the field and select the desired time period. |
| Camera | Press on the field and select the camera you want to receive notifications for from the drop-down list |
Press Search to display the search results. Press Reset to clear the input fields.
To view the location and direction of the camera, press the Location icon.
Events View
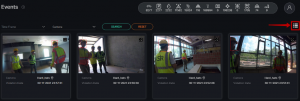
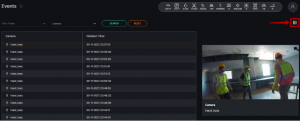
To go to the list view format, press the corresponding icon in the upper-right corner.
To return to the grid format, press the corresponding icon in the upper-right corner again.
Frame View
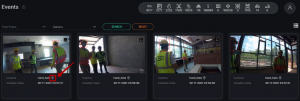
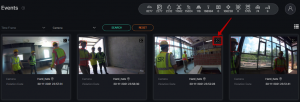
To enlarge a frame with a hardhat wearing regime violation, press the enlargement icon on the photo of interest.
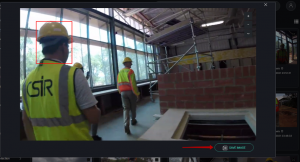
Press "+" to Zoom in or "-" to Zoom out the frame. Press "~" to return the frame to the default size.
If desired, it is possible to save the image by pressing the Save Image button.
